
We are unable to provide license usage reporting (such as charts and tables with summaries of total license usage time for each machine connected over a period of time), since this information is associated with activities on your server to which, of course, we have no access. However, there is a log file on the server that provides this information that can be parsed to populate such tables, charts and reports.
There are three options for generating license usage reporting:
- Develop a Log Parsing Script
- Use a Third-Party Usage Reporting Tool
- Use FlexNet Manager for Engineering Applications
These are discussed below.
Develop a Log Parsing Script
One option is to write a program (e.g., a Python script) that reads the lmadmin log file and generates a usage report. This requires some in-house knowledge about writing a program that parses a text file and working with time series datasets.
For more information about this log file, please scroll down to the section "The GoldSim Network License Log File" below.
Third-Party Usage-Reporting Tools
If you wish for more sophisticated reporting, it is recommended that you try a 3rd-party tool. The option of using a 3rd-party tool is probably the simplest option and doesn't appear to be very expensive. For example, one of the 3rd Party tools we are aware of is called OpenLM.
![]()
Visit their website for more information:
https://www.openlm.com/products/software-license-management-slm/
There are likely other 3rd party options out there too that you may want to consider.
FlexNet Manager for Engineering Applications
A third option is to pay for support from Flexera and buy their tool. There is a special product sold by Flexera that provides usage reporting and analysis for GoldSim network licenses (and would also support other software that also uses Flexera network licenses). To learn more about this product, please see their documentation for the latest release:
Flexera also offers a class to learn how to use this reporting tool should you decide to buy it. For more information, please go here:
This product will allow you to generate the some of the following reports and several more not listed:
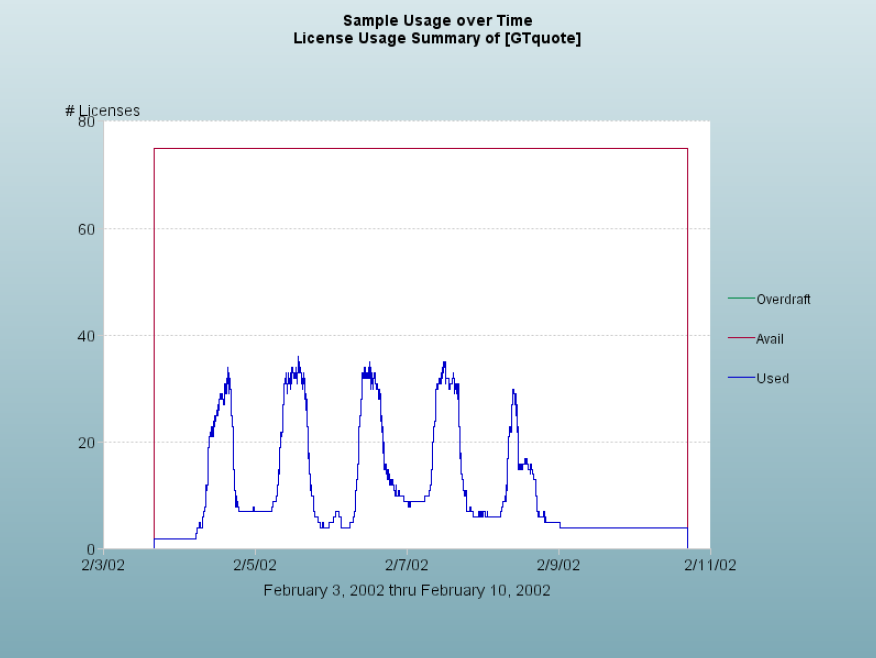
1. Usage Over Time Report - line graph that shows the maximum number of licenses in use over a period of time.
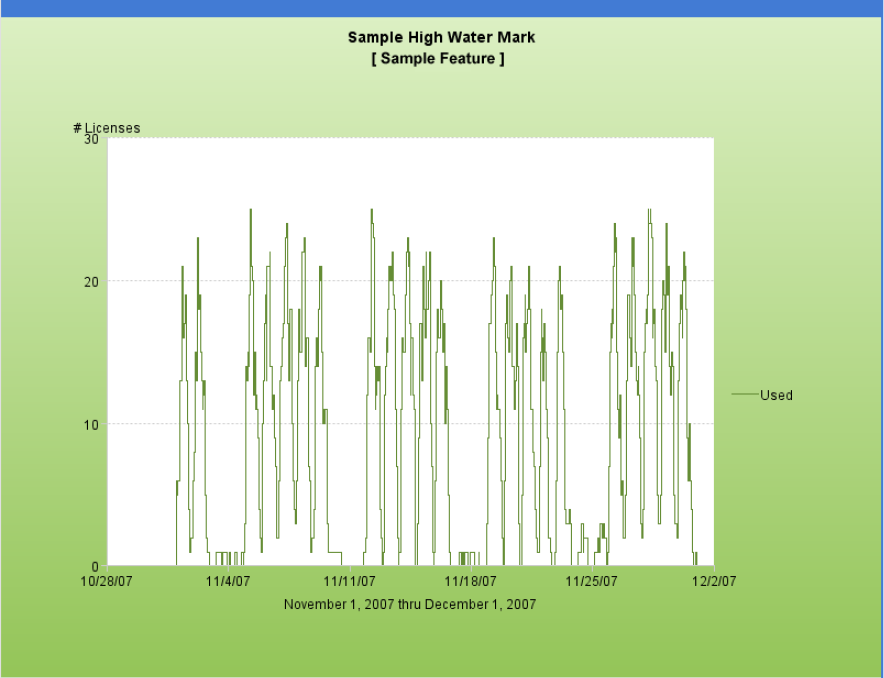
2. High Water Mark Report - a line graph that shows the maximum number of licenses used during a selected time period.
3. Peak Usage and Denial Report - Number of peak usage licenses within the specified summary period. Number of denials within the summary period, if there were any. An optional overdraft line, which shows the number of overdraft licenses at a particular time.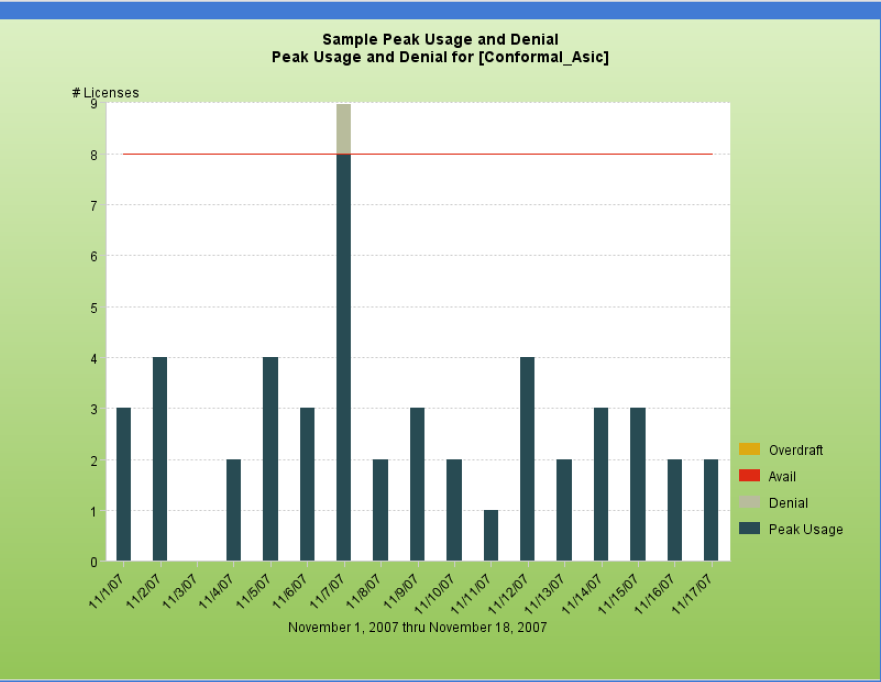
Please contact us at Support if you would like to speak with a Flexera sales representative to find out more about pricing.
The GoldSim Network License Log File
The network license log file called GTG.log contains most of the information that might be needed to generate reports about license usage per client machine over time. It also reports some peak usage information on a default frequency of 240 minutes. Unfortunately, all of this information is not saved in a format that is easily parsed for summary reporting.
GoldSim's network license server (lmadmin) is the program that writes usage information to the log file. The default directory is: C:\ProgramData\FLEXlm\lmadmin\logs
You can also open this file from within the FlexNet License Administrator - Vendor Daemon Configuration page as shown in the screen capture below.
For an example of what the entire log file looks like, please see the link at the bottom of this article to download the log from my own computer, which is hosting a 4-seat network license with all add-on modules. When the vendor daemon starts up (usually just following the time the lmadmin service starts up), the lmadmin program appends to the end of the GTG.log file some introductory information.
Note for all the samples shown below, I have removed repetitive information to make it easier to read.
Original text in the log:
8:05:53 (GTG) SLOG: Activation borrow reclaim percentage is 0.
8:05:53 (GTG) (@GTG-SLOG@) ===============================================
8:05:53 (GTG) (@GTG-SLOG@) === Vendor Daemon ===
8:05:53 (GTG) (@GTG-SLOG@) Vendor daemon: GTG
8:05:53 (GTG) (@GTG-SLOG@) Start-Date: Thu Dec 08 2022 08:05:53 Pacific Standard Time
Formatted text for your viewing pleasure:
Activation borrow reclaim percentage is 0.
===============================================
=== Vendor Daemon ===
Vendor daemon: GTG
Start-Date: Thu Dec 08 2022 08:05:53 Pacific Standard Time
The first section is information about the server and GoldSim products available on the license server. This information is written right after the lmadmin service starts. In my case, it happened right after I powered on my computer for the day. The name of my computer is ISQ-X1EXTREME
As shown below, the products I have available on my license include
- GSCore_Pro
GSModule_DistributedPlus - GSModule_Reliability
- GSModule_TransRadionuclide
Summary LOG statistics is enabled.
FNPLS-INTERNAL-CKPT1
VM Status: 255
FNPLS-INTERNAL-CKPT5
TPM Status: 1
FNPLS-INTERNAL-CKPT6
Server started on ISQ-X1EXTREME for: GSCore_Pro GSModule_DistributedPlus GSModule_Reliability GSModule_Reliability
GSModule_TransRadionuclide
EXTERNAL FILTERS are OFF
Statistics Log Frequency is 240 minute(s).
TS update poll interval is 600 seconds. (See Note 1 below)
Activation borrow reclaim percentage is 0.
===============================================
Notes:
- "TS" stands for Trusted Storage, which is where the network licenses are stored
It also reports the frequency that statistics are written (240 minutes by default) and poll update, which is mentioned below. I have not borrowed a license lately so it is reported as zero on the final line of this section.
Next we see information about the vendor daemon. The version shown below was written in December of 2022 and now might be out of date. Please make sure you have the latest version, which can be downloaded from here: NetworkDownloads - FNPLS
=== Vendor Daemon ===
Vendor daemon: GTG
Start-Date: Thu Dec 08 2022 08:05:53 Pacific Standard Time
PID: 4136
VD Version: v11.16.2.1 build 245043 i86_n3 ( build 245043 (ipv6))

=== Startup/Restart Info ===
Options file used: None
Is vendor daemon a CVD: No
Is FlexNet Licensing Service installed and compatible: Yes
FlexNet Licensing Service Version: 11.16.2.1
Is TS accessed: Yes
TS access time: Thu Dec 08 2022 08:05:53 Pacific Standard Time
Number of VD restarts since LS startup: 0
The next section is a report on the network communication that occurs when a GoldSim client is started. The listening port is the number used in the GoldSim client to get the network license. In my case, I run a GoldSim client on my computer that also hosts my network license. This is an unusual set up but useful for my testing purposes. Typically, a network license is installed on a Windows Server machine. The name of my client machine is JasonLillywhite@ISQ-X1EXTREME
=== Network Info ===
Listening port: 52188
Daemon select timeout (in seconds): 1

=== Host Info ===
Host used in license file: ISQ-X1EXTREME
HostID node-locked in license file: NA
HostID of the License Server: "482ae3308c0f d43b041e59c0 d43b041e59c3 d43b041e59bf"
Running on Hypervisor: None (Physical)
At startup, the statistical report on peak usage is also written at this point. But this is the same report that is added every 240 minutes. I describe this further below. When I started GoldSim on my computer, the seats required to run GoldSim + DP + RL + DP were checked out. The word "OUT" indicates the license is acquired for use by a client. Timestamps are shown in the below example since this is an important part of each line.
TCP_NODELAY NOT enabled
12:44:26 (GTG) OUT: "GSCore_Pro" Jason543User@WSG-X1XTREME
12:44:26 (GTG) OUT: "GSModule_TransRadionuclide" Jason543User@WSG-X1XTREME
12:44:26 (GTG) OUT: "GSModule_Reliability" Jason543User@WSG-X1XTREME
12:44:26 (GTG) OUT: "GSModule_DistributedPlus" Jason543User@WSG-X1XTREME
This is followed by a report of the times when the GoldSim client application is closed. This is noted with the word "IN:" In my case below, the GoldSim program stopped
16:51:52 (GTG) IN: "GSCore_Pro" Jason543User@WSG-X1XTREME
16:51:52 (GTG) IN: "GSModule_DistributedPlus" Jason543User@WSG-X1XTREME
16:51:52 (GTG) IN: "GSModule_Reliability" Jason543User@WSG-X1XTREME
16:51:52 (GTG) IN: "GSModule_TransRadionuclide" Jason543User@WSG-X1XTREME
I shut my computer down a few minutes after this time. When this process starts, the lmadmin service shuts down after writing this:
16:54:27 (GTG) Lost communications with lmgrd.
Communications error. Connection closed.
Exiting.
16:54:27 (GTG) EXITING DUE TO SIGNAL 28 Exit reason 5
On a Windows Server machine, it is much less likely to see the above error unless the service shuts down.
Periodically throughout the day (every 240 minutes by default), a summary of usage will be written to the log file. The beginning part is just a report of time required for communication and is likely not very useful unless you are seeing large delays.
This section reports the top 10 peak operations time. Since I didn't have any peak times greater than 4 seconds, nothing got recorded. Note, I have only been using 1 of 4 available seats so I would not show any peak usage values here.
===============================================
=== Last 10 Client Requests Processing Time (in ms) ===
Time: Thu Dec 08 2022 16:05:56 Pacific Standard Time
Request processing time, when, #concurrent clients, (private bytes (in KB)), client info (user, node, FD)
00000000 ms at Thu Dec 08 2022 16:05:31 Pacific Standard Time,#4,(4988K),(JasonLillywhite,ISQ-X1EXTREME,824)
...repetative lines skipped - they all say 00000000 ms...
00000000 ms at Thu Dec 08 2022 15:58:46 Pacific Standard Time,#5,(4988K),(JasonLillywhite,ISQ-X1EXTREME,1540)

=== Top 10 Peak Client Requests Processing Time (in ms) ===
Time: Thu Dec 08 2022 16:05:56 Pacific Standard Time
Request processing time, when, #concurrent clients, (private bytes (in KB)), client info (user, node, FD)
00000125 ms at Thu Dec 08 2022 13:05:56 Pacific Standard Time,#5,(4916K),(user,host,996)
...repetative lines skipped - they all say similar times...
00000093 ms at Thu Dec 08 2022 12:15:55 Pacific Standard Time,#4,(4916K),(user,host,1028)

=== Top 10 Peak In-house Operations time (in ms) ===
NOTE: Peak times greater than 4 seconds get recorded.
Time: Thu Dec 08 2022 16:05:56 Pacific Standard Time
In-house operation time, when, #concurrent clients

=== Active Connections Info ===
Peak active connections #5 attempted at Thu Dec 08 2022 12:45:55 Pacific Standard Time

=== Memory Usage Info ===
Peak private bytes 5448K attempted at Thu Dec 08 2022 08:07:32 Pacific Standard Time
===============================================
As long as the vendor daemon is up and running, this log file will grow with each new section as described above. It is possible to write a program that parses this file and provides data for reporting on. This option is described further below.
Comments
0 comments
Please sign in to leave a comment.