
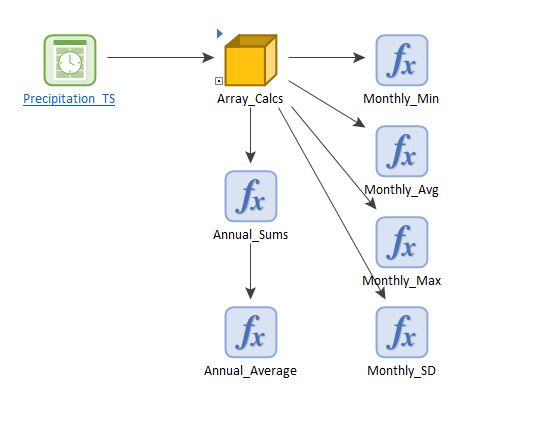
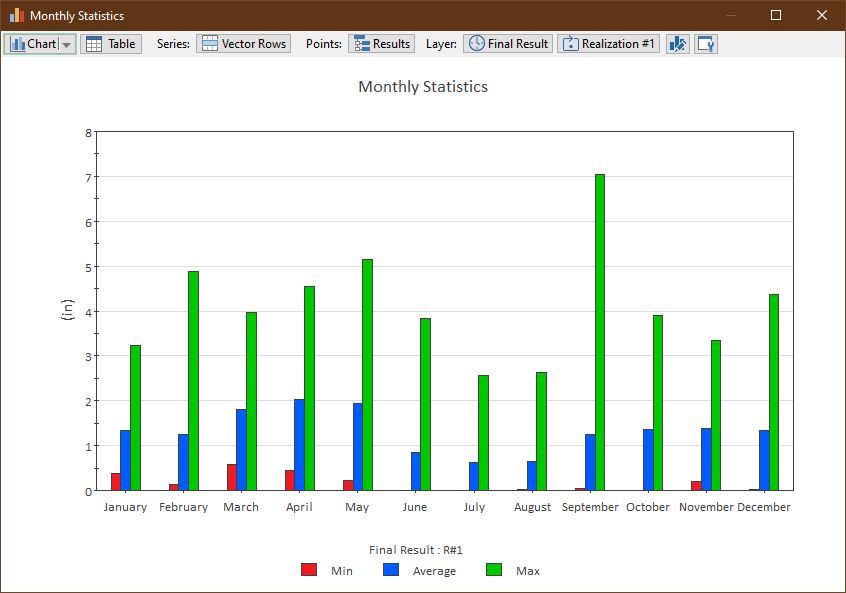
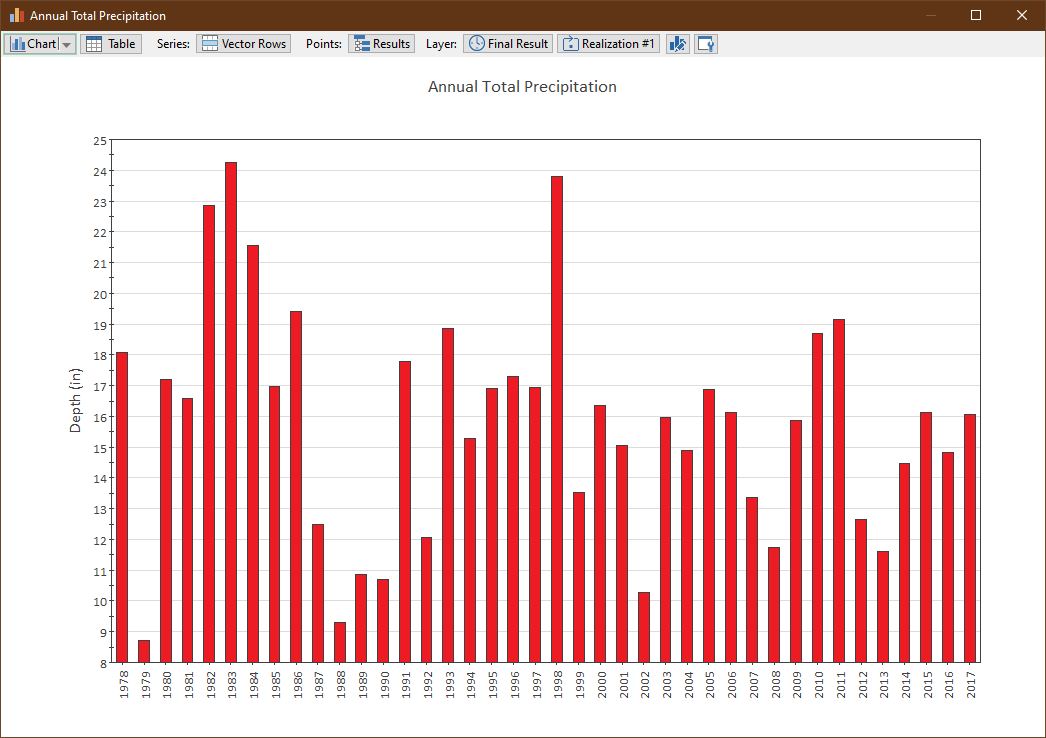
In this example, a time series output is integrated over the period of record (Simulation Duration) to generate monthly and annual sums. The results are stored in a matrix ('Sum_Matrix') in which the rows correspond to years and the columns correspond to months. In this format, it is a simple matter to calculate statistics on the rows or columns using GoldSim's built-in array functions such as meanr(), meanc(), sumr(), sumc(), etc. For example, see results for 'Monthly_Averages' and 'Annual_Sums'. Sometimes, this approach is needed instead of GoldSim's built-in reporting periods because the summary values must be used as inputs to other expressions in the model.
Comments
2 comments
In the first figure above, is there a way to present percentile results? I know is possible in separate graphs, but I would like to have them in the same one.
Gonzalo,
Good question! My first thought was that maybe a Distribution Result would be better for this type of situation. You could easily build this into this type of model, showing the full probability distribution for each month. What about a result like this?
Please sign in to leave a comment.